
Rangers Pitching Study
An SQL-driven analysis providing a comprehensive overview of pitching statistics for the Texas Rangers baseball team.
Learn moreThis project offers a comprehensive analysis of the Rangers' pitching statistics, employing a range of SQL techniques to unearth pivotal insights about the team's performance, strategies, and player tendencies.
Ensuring data integrity was paramount. Rigorous data cleaning processes were employed to rectify inconsistencies, filter outliers, and handle missing values. With this solid foundation, an array of SQL techniques was used to manipulate and structure the data for insightful analyses:
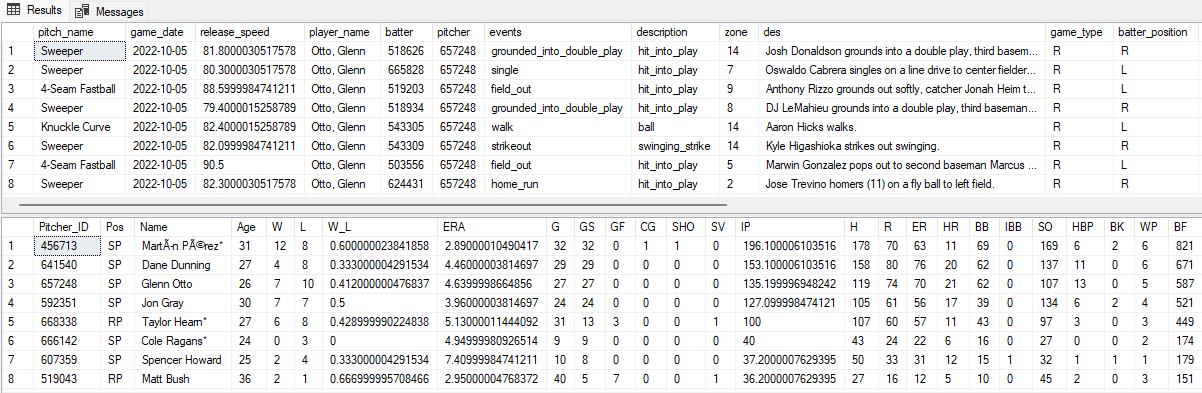
We began our investigation by diving into two foundational datasets: LastPitchRangers and RangersPitchingStats. This initial exploration laid the groundwork for our subsequent deep dives.
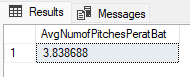
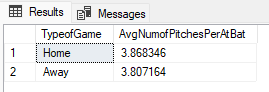
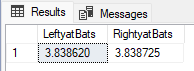
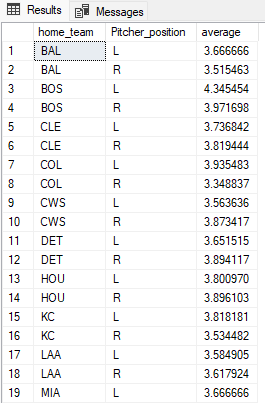
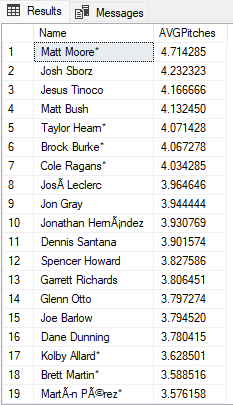
Next, we ventured into the game's core, unraveling the average number of pitches per at-bat. An interesting comparison emerged between home and away games, hinting at the subtle influences of familiar grounds. Our analysis further branched out, contrasting performances against lefty and righty batters. The spotlight then shifted to individual pitchers, particularly those who had clocked more than 20 innings, showcasing the stalwarts of the game.
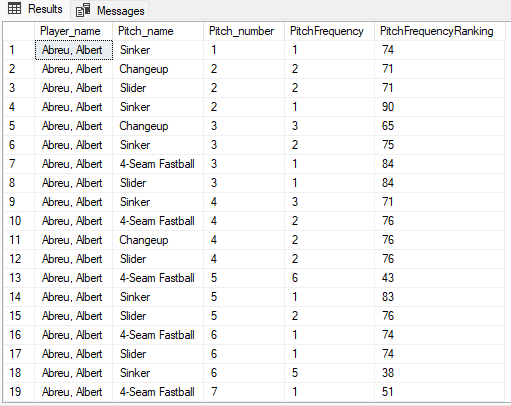
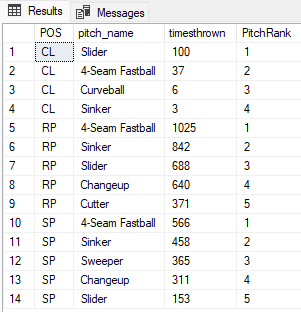
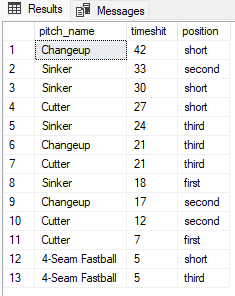
Our curiosity led us to pitch preferences. We unearthed the top 3 pitches that dominated the first ten at-bats, hinting at possible early-game tactics or pitcher inclinations.
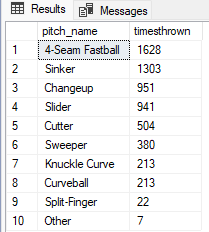
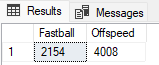
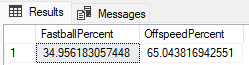
Our focus then pivoted to the climactic moments of each at-bat: the final pitch. We categorized these pitches as either fastball or offspeed. In doing so, intriguing patterns surfaced, suggesting whether pitchers leaned towards sheer velocity or cunning deception in those defining moments.
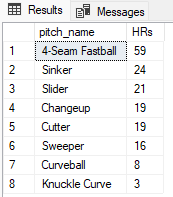
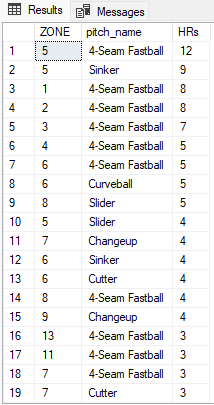
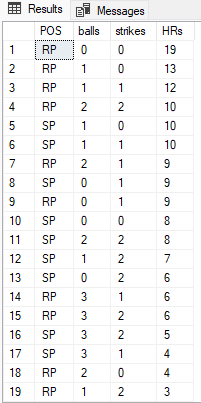
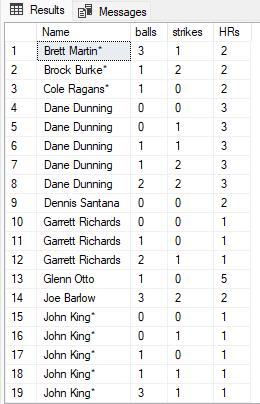
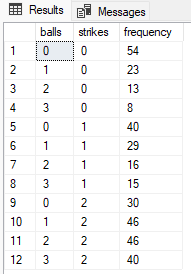
The thrill of home runs couldn't be ignored. What kind of pitches led to these game changing moments? By dissecting home runs based on pitch type, location, and the ball-strike count, we discerned patterns that could hold the keys to future strategies.
One player, 'Pérez, Martín', particularly caught our attention. A deep dive into his pitch zones offered insights into player-specific tactics or potential vulnerabilities.
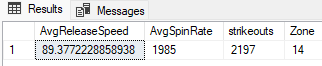
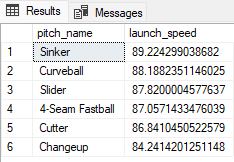
As our journey nears its conclusion, we dive into other intricate metrics like release speed, spin rate, and more. This segment offers a balanced mix of power, precision, and strategy, painting a vivid picture of the pitcher's arsenal.
This project unraveled several profound insights
In this meticulously crafted analysis, we journeyed through the intricate tapestry of pitching strategies, uncovering invaluable insights that redefine the understanding of the game. By diving into the nuances of average pitches, deciphering pitch preferences, and spotlighting critical moments like home runs, the project illuminates the complex interplay of strategy, psychology, and raw skill on the baseball field. The focused analysis on specific players, such as 'Pérez, Martín', underscores the importance of tailored strategies in modern baseball. As a conclusion, this project not only offers a data-driven lens to view the sport but also emphasizes the profound impact of informed decision-making in turning the tide of any match.
This SQL project, in essence, is a comprehensive exploration into the art and science of pitching. Each query, each segment, stitches together to form a tapestry that showcases the strategy, skill, and suspense of the game. From broad strokes to fine details, the project is a testament to the depth and beauty of baseball analysis.
In the dynamic and expansive universe of "Path of Exile" (PoE), in-game currency plays a pivotal role, with its value fluctuating based on myriad of in-game and community factors. Recognizing the need for a comprehensive view of these fluctuations, I embarked on a journey to create an interactive dashboard leveraging the rich data available from the Path of Exile API.
The centerpiece of the dashboard is a line chart that vividly illustrates the evolution of currency values over time. This chart provides a snapshot of the market trends, giving players insights into the best times to buy or sell.
Users have the flexibility to select any specific currency and track its performance across different PoE leagues. This ensures that the dashboard caters to the diverse interests of the player base, whether they are traders, casual players, or ardent fans.
By making sense of vast amounts of data, this dashboard is not just a visual tool but also an analytical one. It aids players in making informed decisions, understanding market anomalies, and planning their in-game strategies more effectively.
The primary tool used for creating the interactive visualization, known for its robustness and versatility in handling complex datasets.
This was the main data source, offering up-to-date and historical data on in-game currency values. The data was meticulously extracted, cleaned, and processed to ensure accuracy and relevance.
In conclusion, this project was a harmonious blend of my passion for gaming and expertise in financial data analytics. It stands as a testament to the power of data visualization in making complex data sets comprehensible, actionable, and engaging. Whether you are a PoE enthusiast or a data aficionado, this dashboard promises to offer valuable insights and a intuitive user experience.
This Python developed Portfolio Analysis Tool excels with its application of Monte Carlo simulations and Efficient Frontier modeling. This software provides a comprehensive understanding of potential stock portfolio scenarios, helping users visualize the risk-return trade-offs of their chosen stocks, while also granting them the flexibility to input custom weights.
Monte Carlo simulations use random sampling to generate a multitude of potential asset return scenarios based on historical data.
The tool generates thousands of potential portfolios by randomly assigning different weight combinations to each stock. However, for users with specific investment strategies or preferences, there's the option to input custom weights for each stock, offering a more tailored analysis.
Users are presented with a wide array of portfolios, each showcasing a unique blend of expected returns and associated volatilities.
All simulated portfolios are plotted on a graph. The Efficient Frontier, representing the optimal portfolios, emerges as the upper boundary of this plot.
The Portfolio Analysis Tool's strength lies in its integration of advanced techniques like Monte Carlo simulations with Efficient Frontier modeling and its adaptability to user preferences through custom weight inputs. This combination ensures both a broad analytical perspective and a tailored experience for users.
This Portfolio Analysis Tool provides an advanced yet user-friendly platform for stock portfolio analysis. By offering insights derived from Monte Carlo simulations, Efficient Frontier modeling, and other key financial metrics, while also accommodating custom inputs, it ensures users are equipped to make well-informed investment decisions.
A comprehensive examination of Nvidia, delving into its strategic positioning within the semiconductor industry. This analysis deciphers the company's financial health, performance metrics, and competitive landscape. Leveraging financial statements and industry data, this report offers insights into Nvidia's growth trajectory, profitability, and potential risks, providing a holistic understanding of its business dynamics.
Dive into a diverse collection of analytical projects that span the realms of gaming, finance, and sports. My portfolio showcases the application of data-driven techniques using various tools to unearth insights and facilitate decision-making in my favorite hobbies.
An SQL-driven analysis providing a comprehensive overview of pitching statistics for the Texas Rangers baseball team.
Learn more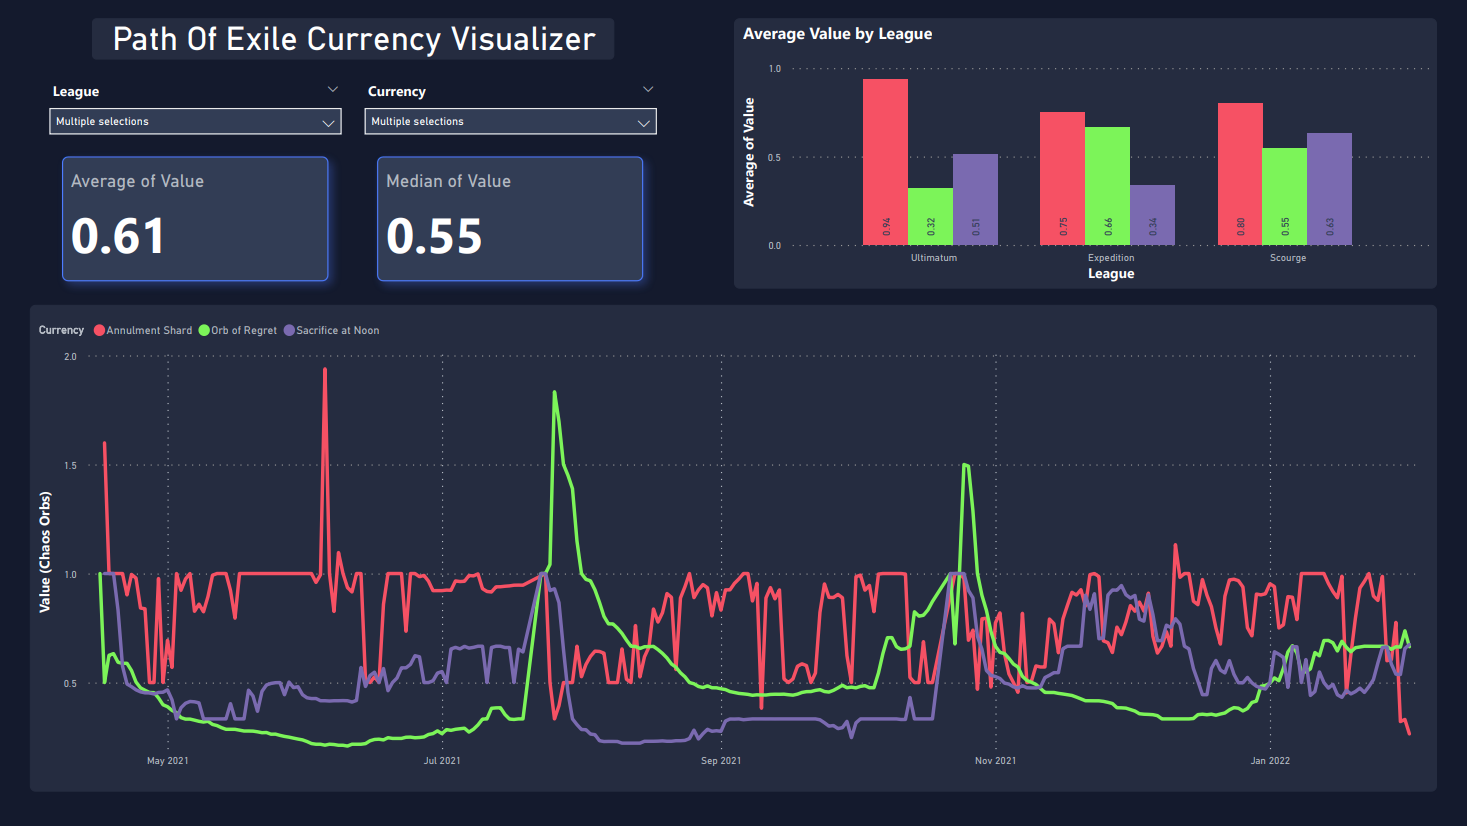
A Power BI dashboard visualizing in-game currency values and financial trends for the game Path of Exile.
Learn more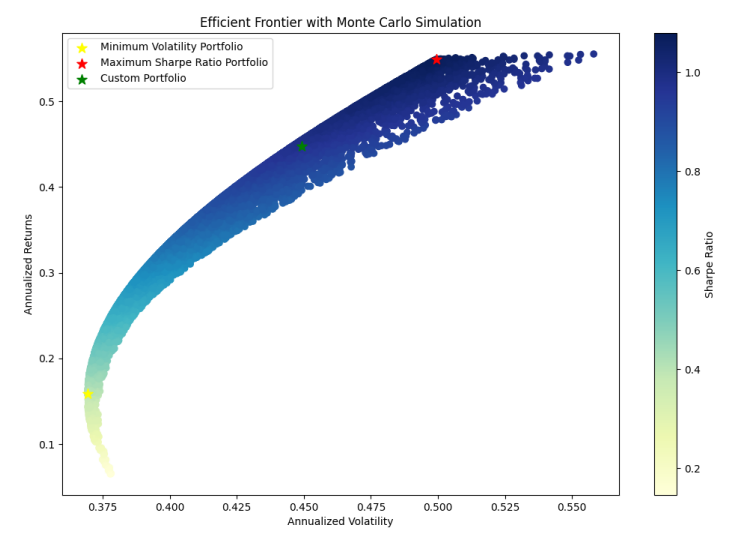
A Python program designed to perform financial analysis on a stock portfolio by comparing their historical data and utilizing Monte Carlo simulations
Learn more
A comprehensive deep dive into Nvidia's financial health and strategic prowess in the semiconductor industry.
Learn more